I was inspired today to get XHProf working on my Mac, using MAMP PRO 2.0.5/PHP 5.3.6, after reading @Dave Reid's tweet. Since I'm not leaving for DrupalCon until tomorrow, what else could I do today? There's an excellent article on Lullabot that will help you get 85% of the way towards having XHProf up and running on your Mac, working with your Drupal sites, but there are a few missing pieces and little tips that will help you get XHProf fully-armed and operational.
Ooh, pretty visualizations!
First, after you've installed and configured XHProf on your Mac (and restarted MAMP/Apache so the configuration takes effect), you need to do a few things to get it working well with Drupal. For starters, if you have the Devel module installed, head over to its configuration page (at admin/config/development/devel), and check the box that says "Enable profiling of all page views and drush requests."
Now, enter the following values in the two fields that appear (note: these paths could be different depending on where you installed xhprof, and how you have your Sites folder/localhost set up. For simplicity, I kept the xhprof stuff in MAMP's htdocs folder):
- xhprof directory:
/Applications/MAMP/htdocs/xhprof - xhprof url:
http://localhost/xhprof/xhprof_html
Save the configuration, and refresh the page. Scroll down to the bottom of the page, and click on the newly-added link in the Developer information section titled 'XHProf output'. You should see a huge table with large, menacing numbers. Don't worry about interpreting them just yet. (If you got an error, or something other than a table of a bunch of functions and numbers, then XHProf is not configured correctly).
Now, click on the [View Full Callgraph] link towards the top of the page. You'll probably get an error like:
Error: either we can not find profile data for run_id [ID-HERE] or the threshold 0.01 is too small or you do not have 'dot' image generation utility installed.This is because GraphViz (which provides the 'dot' utility) is not installed on your computer, or it's not in your $PATH. So, go ahead and download the OS X-compiled version of GraphViz appropriate to your computer (I downloaded the Intel version 2.14.1), and install it (it uses the normal Mac installer, and puts the files in /usr/local/graphviz-2.14).
The final step to get dot working correctly is to make a symlink to the dot binary using ln -s (in my case, /usr/local/bin is in my $PATH, as defined in ~/.bash_profile):
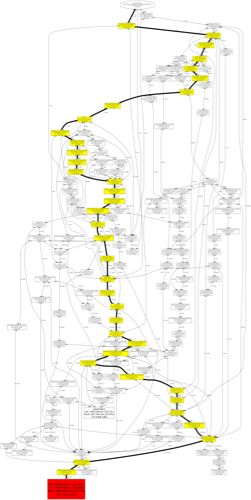
$ sudo ln -s /usr/local/graphviz-2.14/bin/dot /usr/local/bin/dotNOW, go ahead and jump back over to your fancy XHProf data table page, and click the Callgraph link. Wait a minute, and you'll be rewarded with a beautiful graphical representation of where Drupal/PHP spends all its time, with colors, arrows, lines, and numbers to your heart's content!
The last step for getting XHProf would be to install the XHProf module on your site and get the data displaying inside Drupal—but I haven't been able to install it yet on my own site (there was an installation error), and the standard interface that I get (provided by XHProf itself) is good enough for me.
(Remember to clean out the directory where you're saving your XHProf runs every now and then (this directory is configured in php.ini as the xhprof.output_dir variable); each run will be 100-200KB, and that adds up as you load and reload tons of pages!).
Comments
Just a reminder that many of us have no ideas WTF problem you are trying to solve or why. What is the benefit to installing this thing. I follow along to try to learn and discover a new tool, solution to a problem or whatever. Your article as written needs some help. I clicked on the module link you provided and here is something that might be useful to others.
XHProf is a hierarchical profiler for PHP. It reports function-level call counts and inclusive and exclusive metrics such as wall (elapsed) time, CPU time and memory usage. A function's profile can be broken down by callers or callees. The raw data collection component is implemented in C as a PHP Zend extension called xhprof. XHProf has a simple HTML based user interface (written in PHP). The browser based UI for viewing profiler results makes it easy to view results or to share results with peers. A callgraph image view is also supported.
The only thing missing is why I should go to all the trouble - what benefit is there to me. Don't feel bad for some reason this implied assumption that everyone knows about what I am going to describe is prevalent in Drupal contributor and support community.
As Noah says below, profiling your code can help you pinpoint spots in your website/custom code (or contrib, or core) where PHP is spending more time than you'd like processing data in preparation for delivering the resulting page to the end user.
When optimizing performance of your website (especially with lots of custom code and configuration), you should look at how long Drupal has to wait on MySQL results, and see if there are any database queries that need fixing, then you should look at how long Drupal takes to run through all the PHP functions (which XHProf helps with), and then look at the speed of the front-end elements of your site (jQuery, CSS, etc. - how long the end-user's browser takes to download resources and actually display everything).
The main reason I use XHProf is to verify whether or not some of the performance optimizations I make in my code (using a static variable rather than looking up the same data over and over again, optimizing array searching, etc.) are actually making a discernible difference. Some optimizations are way more helpful/valuable than others, and XHProf helps me put a pin on which ones help the most.
Jim, the reason you'd want to have a profiler is so you know what areas of your site to look at to optimize, to make your site faster or more scalable. That's it in a nutshell. It's very specific, but very valuable.
Just found that realize.be posted a good tutorial on how to get XHProf installed using Homebrew: http://realize.be/installing-xhprof-mac-homebrew